
Contents
- I. Why should you use Google tools to test website speed?
- II. Google site speed test tools
- III. How to use Google site speed test tool
- 1. Metrics to know when testing speed with Google tools
- 2. How to use Google website speed measure and analyze tools
- a. How to use Chrome DevTools to test website speed
- b. How to use Lighthouse measures website speed
- c. How to use PageSpeed Insights to analyze website speed
- d. How to use Chrome User Experience Report (CrUX) to test website speed
- e. How to use Google Search Console to test the speed of your website
- f. How to use Web.dev’s measure tool to measure site speed
- g. How to use Web Vitals Chrome Extension to test web speed
- h. How to use Google Test My Site to test website speed
Learn about Google site speed test tools and how to rate your website speed with the website speed test tools of Google.
This article will guide you to check the metrics that Google website speed measuring tools measure and how best to use each of those tools.
I. Why should you use Google tools to test website speed?
1. Why need to check website speed?
Optimizing the quality of the user experience is the key to the long-term success of any website. Whether you are a business owner, marketer or a developer, you need to be mindful of the customer experience when visiting your website. One of the first user experiences when using a website is the speed of the website.
Analyzing more closely, website speed matters for two main reasons. First, a fast-loading website is important for converting customers. Second, Google uses website speed to rank your website in search.

a. The impact of site speed on customer conversions
A Google study has shown that:
“If people have a negative experience on mobile, they’re 62% less likely to purchase from you in the future.”
“A one-second delay in mobile load times can impact mobile conversions by up to 20%.”
It can be seen quite clearly that customers lose patience and leave a website that doesn’t load at lightning speed.
b. The impact of website speed on search ranking
Google has repeatedly emphasized the importance of website speed in particular and web experience in general: “Fast is better than slow”, “Google is striving to make the whole web fast” or “Focus on the user and All else will follow ”…
This has been proven, as Google repeatedly released algorithm updates related to user speed and experience. Additionally, in May 2020, Google launched Web Vitals – an initiative that aims to provide unified guidance for the quality signals needed to deliver a great user experience on the web.
Through the above analysis, we can confirm that user experience in general and website speed, in particular, are factors that greatly affect the conversion of customers to your website. If you are selling on the website but your website is too slow, customers will leave immediately, no conversion will take place no matter how good your item is.
Details: Why website speed is an important matter, should be paid attention to when developing a website?
2. Why should you use Google website speed test tools
To meet the needs of users, Google has been, and continues to update, its algorithms as well as provide indicators to evaluate website speed and user experience. Improving the website according to Google’s metrics is also improving user experience on your website. To measure, analyze and evaluate these metrics most accurately, there is no better tool than Google site speed test tools.

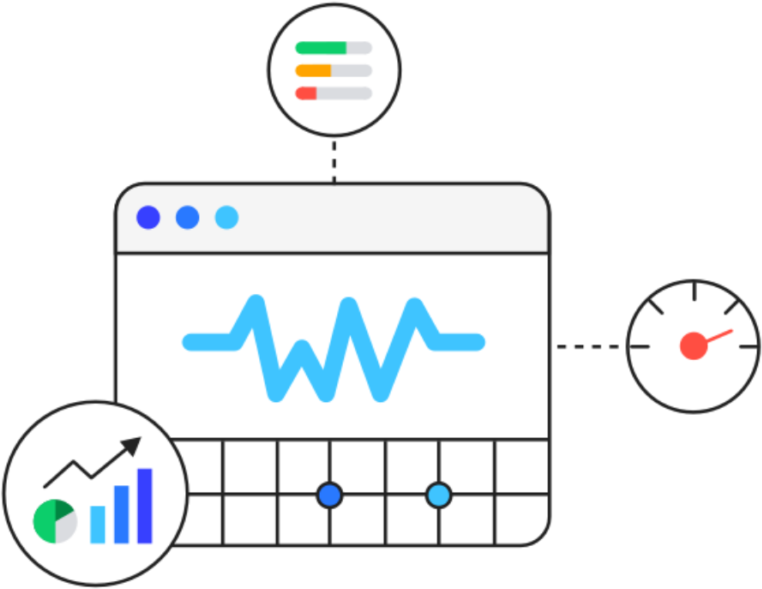
II. Google site speed test tools
Currently, Google has provided some of the best tools for evaluating the speed and experience of a website, including Lighthouse, PageSpeed Insights, Chrome DevTools, Search Console, web.dev’s measure tool, the Web Vitals Chrome extension and Chrome UX Report API.
These tools have been provided by Google for many years to measure and report performance. However, in the past, only a handful of developers were experts in using these tools because of the complexity of the indicators as well as confusing technical terms.
Foreseeing this, Google launched Web Vitals. The Web Vitals Initiative aims to simplify the landscape and help websites focus on the most important metrics, Core Web Vitals. With this initiative, website owners don’t need to be performance experts but are able to easily use the website loading speed test Google tool and understand their metrics of quality of experience are making it available to its users.
To begin your journey of optimizing the user experience with Core Web Vitals, Google has come up with a workflow like this:
- Use Search Console’s new Core Web Vitals report to identify groups of pages that need attention (based on field data).
- Once you’ve identified the pages to test, use PageSpeed Insights (provided by Lighthouse and Chrome UX Report) to diagnose lab and real-world issues of a site.
- Use Lighthouse and Chrome DevTools to measure Core Web Vitals and get exact instructions on what to fix. Chrome’s Vitals Web extension can give you a real-time view of your metrics on your desktop.
- You need real data, Chrome User Experience Reports (Chrome UX Reports) provide user experience metrics of how Chrome users in the real world experience your website.
- Need a custom dashboard for Core Web Vitals? Use the CrUX Dashboard or Chrome UX Report API for field data or PageSpeed Insights API for lab data.
- For guide search you can visit Web.dev/measure, which will have a set of instructions and priority encoding for optimization, using PSI data.
- Finally, use Lighthouse CI for pull requests to ensure there are no regressions in Core Web Vitals before you implement changes to production.
Here we go to find out in detail each of Google website speed test tools!
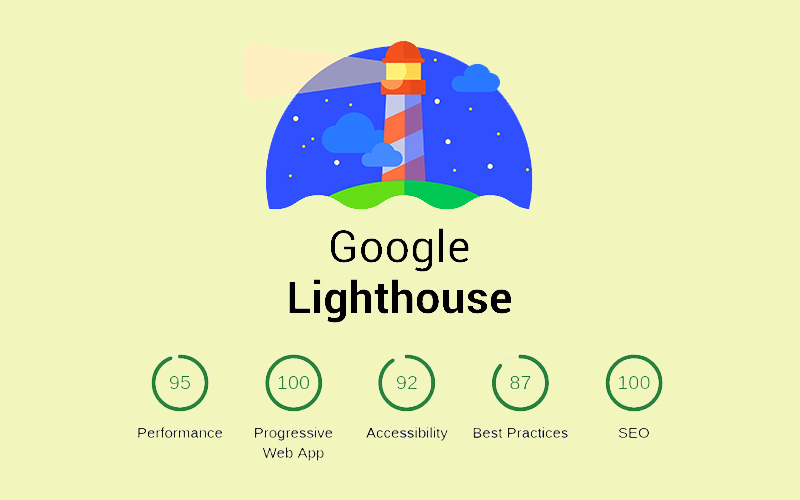
1. Lighthouse
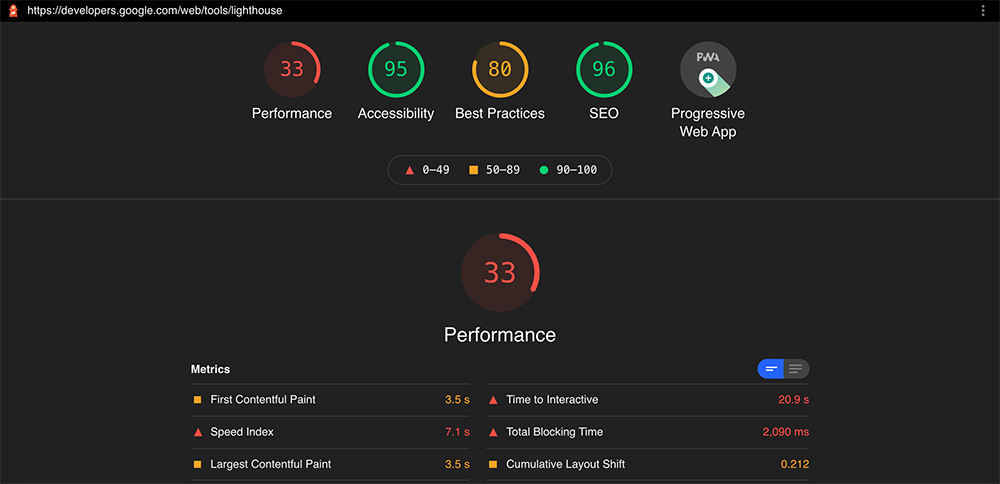
Lighthouse is an automated website audit tool that helps developers diagnose problems and identify opportunities to improve user experience on their website. It measures several aspects of the quality of user experience in a lab environment, including performance, accessibility, progressive web application, SEO …
The newest version of Lighthouse, Lighthouse 6.0, introduces 3 new metrics for the report, including: Largest Contentful Paint (LCP), Cumulative Layout Shift (CLS) and Total Blocking Time (TBT). In which, LCP and CLS are two indices in Core Web Vitals and TBT that correlate well with First Input Delay (FID) – another Core Web Vitals index.
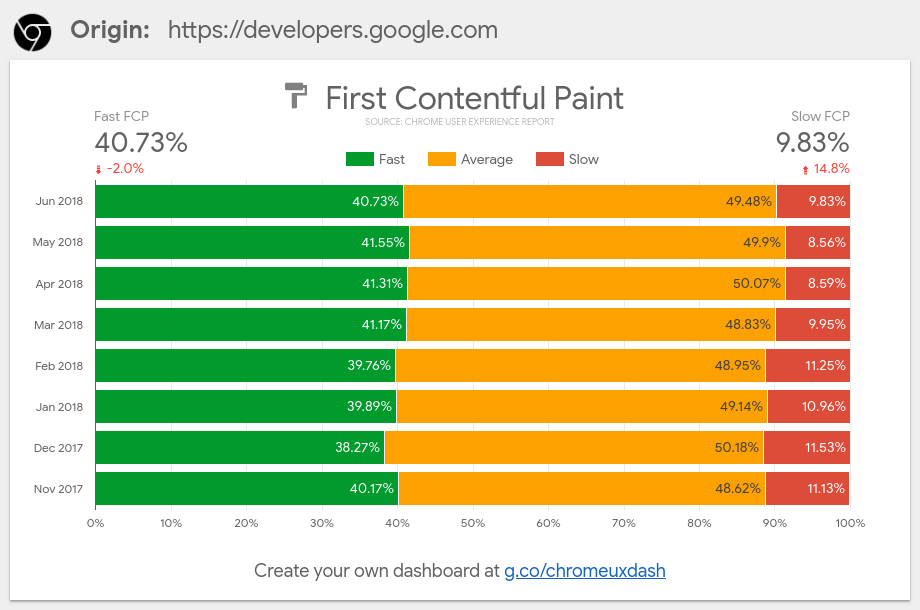
2. Chrome User Experience Report (CrUX)
Chrome User Experience Report is a report that provides real-world user experience metrics when Chrome users (users who have opted in to sync their browsing history, have not yet set up the Sync passphrase and usage statistics reporting enabled) visit and experience public websites.
Currently, the Chrome User Experience Report focuses on loading performance with metrics such as: First Paint, First Contentful Paint, DOMContentLoaded, FID, LCP, CLS, Time to first byte (TTFB)…
3. PageSpeed Insights
PageSpeed Insights (PSI) reports on the performance in the lab as well as the actual performance of a page on both mobile and desktop. This tool provides an overview of how users actually experience the site (provided by Chrome UX Report) and metrics measured in the lab (provided by Lighthouse) from which to make recommendations. Usefulness can help improve the page experience.
Currently, PageSpeed Insights supports measuring Core Web Vitals in both the lab and the field.

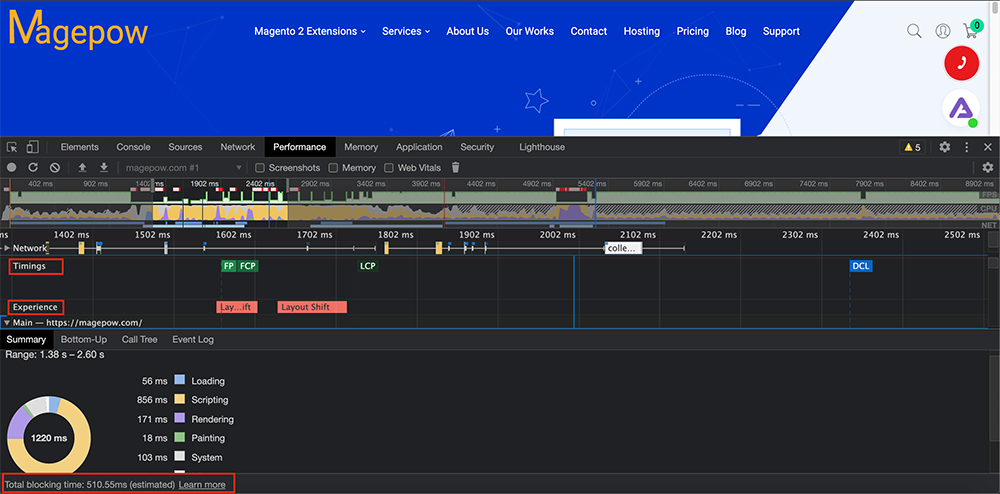
4. Chrome DevTools
Chrome DevTools is a set of web developer tools that are integrated directly into the Google Chrome browser. This tool can help you to quickly edit the page and diagnose problems quickly, which helps you to build better, faster websites.

With this tool you can quickly debug the Layout Change event in the Special Experiences section DevTools is ready to interactively debug with Total Block Time in the footer.
Total Intercept Time (TBT) can be measured with laboratory tools and is a great alternative to FID. Optimizing performance to improve TBT in the lab can help improve FID for websites.
5. Google Search Console
Search Console tools and reports help you measure traffic from Search and your site’s performance, get your content on Google, fix problems and increase your site’s ranking in Google results Search.
In it, the new Core Web Vitals Report in Search Console will help you identify the groups of pages on your website that need your attention, based on actual data from CrUX. URL performance is grouped by status, metric type, and URL group (group of similar sites) with 3 metrics: LCP, FID, and CLS.
Once you have identified problematic pages related to Core Web Vitals on your website, you can use PageSpeed Insights to learn about optimization recommendations specific to these pages.

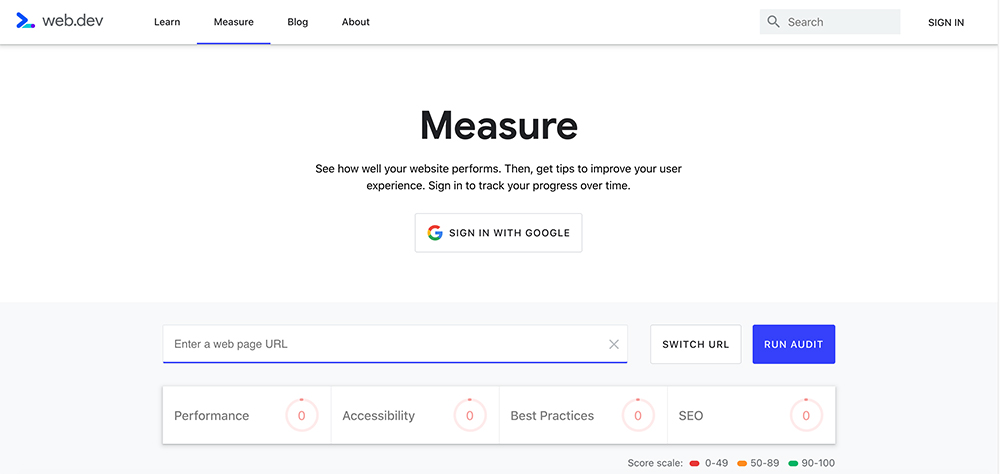
6. Web.dev’s measure tool
Web.dev/measure allows you to measure your site’s performance and speed over time, it also provides a prioritized list of tutorials and codelabs on how to improve. Its metrics are powered by PageSpeed Insights. This Google site speed test tool now also supports Core Web Vitals metrics.

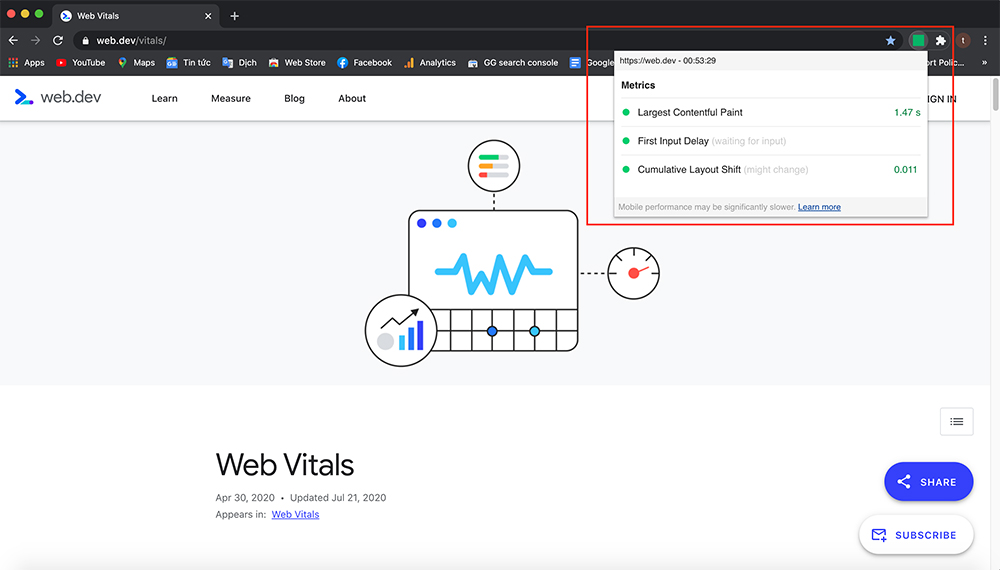
7. Web Vitals Chrome extension
The Web Vitals Chrome extension is provided in the Chrome Web Store Extension, which measures three Core Web Vitals metrics in real-time for Google Chrome on desktops and laptops. This is useful for the early detection of problems in your web development and as a diagnostic tool for evaluating the performance of Core Web Vitals as you browse the web.
8. Google Test My Site
Currently, mobile devices are used more by users than desktop computers or laptops, so you not only need to pay attention to improve website speed on your computer, but also optimize the web speed on mobile devices. Foreseeing this, Google has released Test My Site – 1 useful tool to test website speed on mobile devices in 4G (3G) network environment. After testing your website, the tool also provides suggestions for enhancing your mobile site experience.

In addition to Google speed checker websites, you can refer to other website speed test tools.
III. How to use Google site speed test tool
1. Metrics to know when testing speed with Google tools
In order to be able to use Google tools to test the performance, website speed and be able to analyze, evaluate and come up with the right solutions, you need to understand the metrics these tools use.
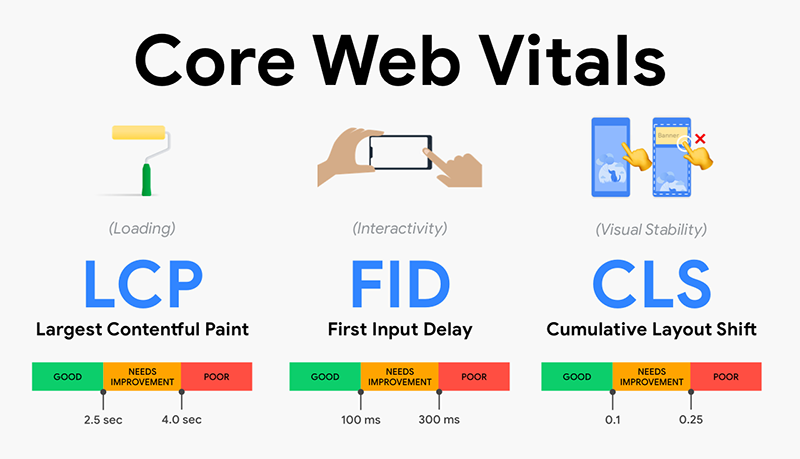
Among them, the Core Web Vitals metrics are the most important. This is a set of indicators for Web Vitals. Each Core Web Vitals represents a different aspect of the user experience.
The metrics Core Web Vitals will evolve over time. The current set focuses on three aspects of the user experience: loading, interacting and image stabilization, corresponding to three metrics: Largest Contentful Paint (LCP), First Input Delay (FID) and Cumulative Layout Shift (CLS).
In addition, you can also learn more about metrics such as: First Contentful Paint (FCP), Time To Interactive (TTI), Total Blocking Time (TBT) …
2. How to use Google website speed measure and analyze tools
a. How to use Chrome DevTools to test website speed
In Google Chrome, go to the URL you want to check.
Open Chrome DevTools (right-click an element on the page and choose Inspect to switch to the Elements panel or press Command + Option + C (for Mac) or Control + Shift + C (for Windows, Linux, Chrome OS).
Click the Performance tab, click the reload button “Start profiling and reload page” (As shown below) or key combination Command + Shift + E (Mac) or Ctrl + Shift + E (Win) to rewrite the page load.
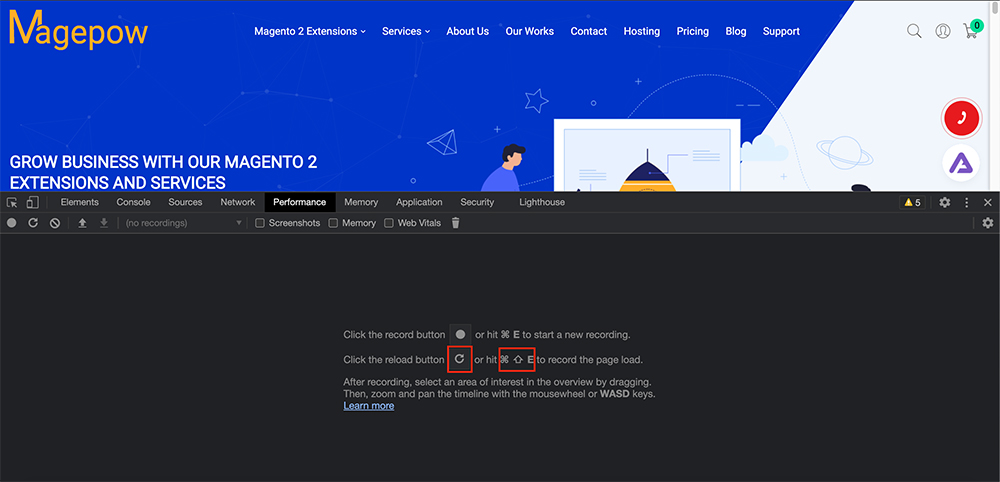
Then, a board will appear, wait 5 – 10 seconds, then press the button “Stop”. Wait a moment, you will see the test results.
You can refer to: Optimizing website speed with Chrome DevTools, for more detailed information.
b. How to use Lighthouse measures website speed
Choose the way to run the Lighthouse that best suits you:
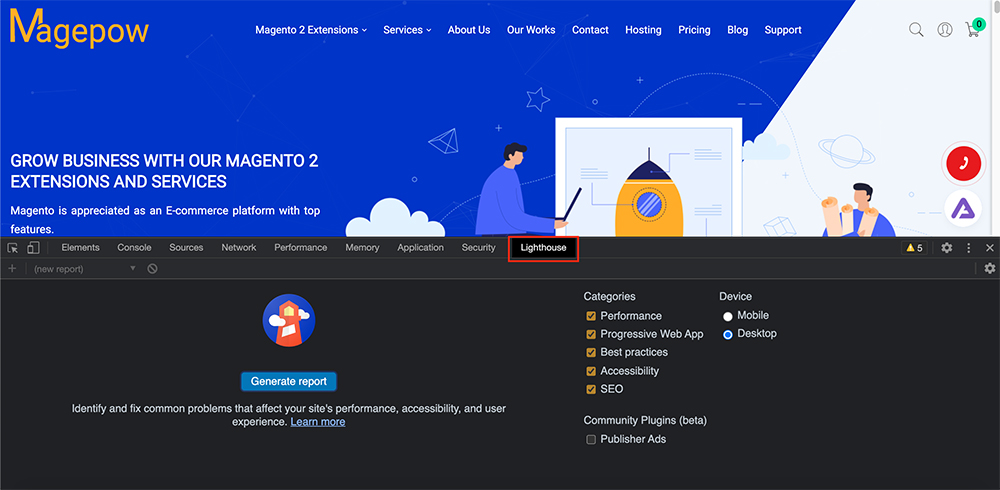
Method 2: Run Lighthouse in Chrome DevTools
- In Google Chrome, go to the URL you want to check.
- Open Chrome DevTools (see part “a” above)
- Click on the Lighthouse tab. In the menu select Categories and Device (Mobile or Desktop).
- Click Generate Report. After 30 to 60 seconds, the Lighthouse provides you with a report on the page.
Method 2: Run Lighthouse as a Chrome Extension
- Install Lighthouse Chrome Extensions from the Chrome Web Store.
- In Chrome, go to the page you want to check.
- Click on Lighthouse. It will be next to the Chrome address bar (if you don’t see it, you can find it under the Extension icon in the toolbar). Once clicked, the Lighthouse menu will expand.
- Click Generate Report. Lighthouse tests the currently focused site then opens a new tab with the results report.
You can see 2 other ways to open the Lighthouse here.
c. How to use PageSpeed Insights to analyze website speed
How to use PageSpeed Insights is quite simple, you just need to visit PageSpeed Insights, enter the URL of the page you need to check, click Analyze. Wait about 30 seconds, you will be presented with a data sheet and suggestions to improve the website speed.
d. How to use Chrome User Experience Report (CrUX) to test website speed
To extract insights from Chrome UX Reports, you can use the following 3 ways:
- Using PageSpeed Insights, this tool will provide URL-level user experience metrics for popular URLs known by Google’s web crawler.
- Using Google’s BigQuery Project, this project is public, aggregating user experience indicators. See more: A guide to using Chrome UX reports on BigQuery.
- Uses CrUX Dashboard on Data Studio, which can be set up to track user experience trends. Watch now: Use the CrUX Dashboard on Data Studio.
For quick and easy analysis of website performance, PageSpeed Insights and CrUX Dashboard are recommended tools.
e. How to use Google Search Console to test the speed of your website
Go to your Google Search Console, at the main menu look for “Enhancement” and select “Core Web Vitals”, you will see URLs with speed problems on both mobile and desktop. Click “Open Report” to view details.
f. How to use Web.dev’s measure tool to measure site speed
Go to Web.dev’s measure tool.
Enter the URL of your website. Click “Run Audit”.
See your site’s performance, speed on the areas of interest.
Each test comes with useful steps to improve your website’s results, you can refer to to improve performance, speed for your website.
g. How to use Web Vitals Chrome Extension to test web speed
Web Vitals is available now on the Chrome Web Store. You Install Vitals Web Extensions from the Chrome Web Store. In Chrome, go to the page you want to check. Click the Web Vitals icon on the toolbar, this extension will measure 3 indicators of Largest Contentful Paint, First Input Delay and Cumulative Layout Shift right at that time.
h. How to use Google Test My Site to test website speed
Go to Google Test My Site, enter the domain you want to speed test in and press “Enter ‘(Win) or“ Return’ (Mac) to proceed with the test. This tool will measure the page speed on mobile devices with 4G (or 3G) connection, click Get your full report, fill in the necessary information and click submit if you want to receive a full report on optimizations. Customization and recommended tools to improve website speed on mobile devices.
Above are some of the Google website speed testing tools that Magepow has learned. We hope this article will be useful to you.
After testing the website with Google site speed test tools, if your Magento website is slow try to install Magento 2 Speed Optimizer Extension or use our Magento Speed Optimization service to speed up your website!