
Contents
Lighthouse is a pagespeed test tool – this is absolutely true, but not enough. Let Magepow learn about the Lighthouse pagespeed test and how to use this tool effectively in this article.
I. Google Lighthouse – pagespeed test tool?
Lighthouse is a free Google tool that helps improve the quality of websites (either publicity or requires validation).
Google Lighthouse is not simply a pagespeed test tool, but also a versatile tool capable of checking the performance, accessibility, best practices, SEO, progressive web app … of a website, point out what has not been achieved and offer solutions to improve your website for optimal speed, performance and most importantly user experience.

II. How to use Lighthouse Google?
1. How to run Google Lighthouse?
a. Run Lighthouse in Chrome DevTools
To run Lighthouse in Chrome DevTools you need to browse the web in Chrome browser, if not, you can download it here.
Once downloaded and installed, in Google Chrome, go to the URL to check (you can check every URL of the website).
To open Chrome DevTools, right-click anywhere, select “Inspect” or press Command + Option + C (for Mac) or Control + Shift + C (for Windows, Linux, Chrome OS), Chrome DevTools will appear.
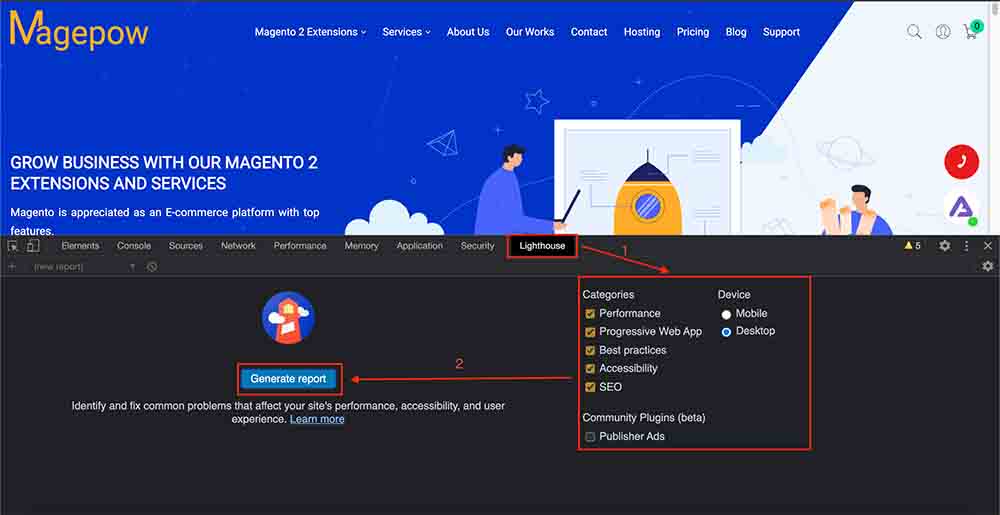
On this panel select the Lighthouse tab.
- At Categories, there are 5 items: Performance, Accessibility, Best Practices, SEO, Progressive Web App (you can deselect if you do not want to check a certain item).
- At Device, select the device you want to check, Mobile or Desktop.
- Choose Publisher Ads if you want to test the page is optimized for ad speed and quality.
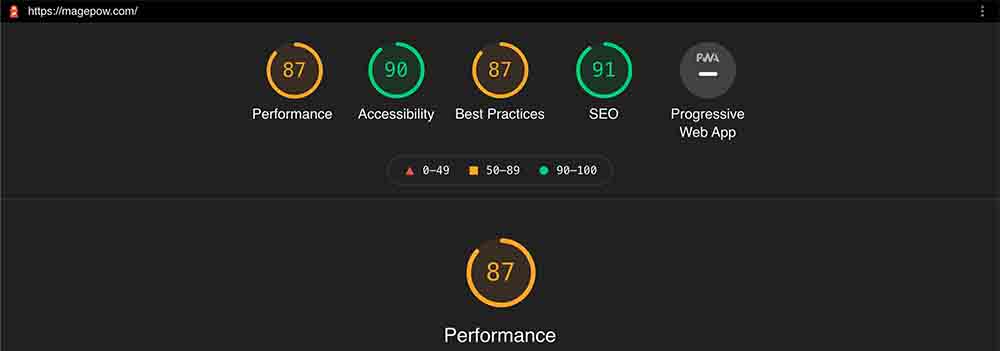
After you have selected the necessary items, click Generate Report to begin the Lighthouse inspection process. After 30 – 60 seconds, the report will be displayed immediately on the page.
b. Run Lighthouse as a Chrome Extension
This way, you also need to use the Chrome browser.
Install extensions: Add and install Lighthouse Chrome Extensions from the Chrome Webstore.
Run the test:
- In Google Chrome, go to the page you want to check.
- Click on the Lighthouse Extension Lighthouse icon. It will be next to the Chrome address bar. If you don’t see it, click on the Extension icon, look for the Lighthouse icon and click on the Pin icon to pin it to the toolbar.
- Once clicked, the Lighthouse menu will expand, press Generate Report to initiate the Lighthouse inspection process.
- You will then see a new tab open showing the results report.
c. Run PageSpeed Insights
Follow the steps below to run Lighthouse on PageSpeed Insights:
- Go to Google Pagespeed Insights.
- Enter the website URL you want to test.
- Click Analyze.
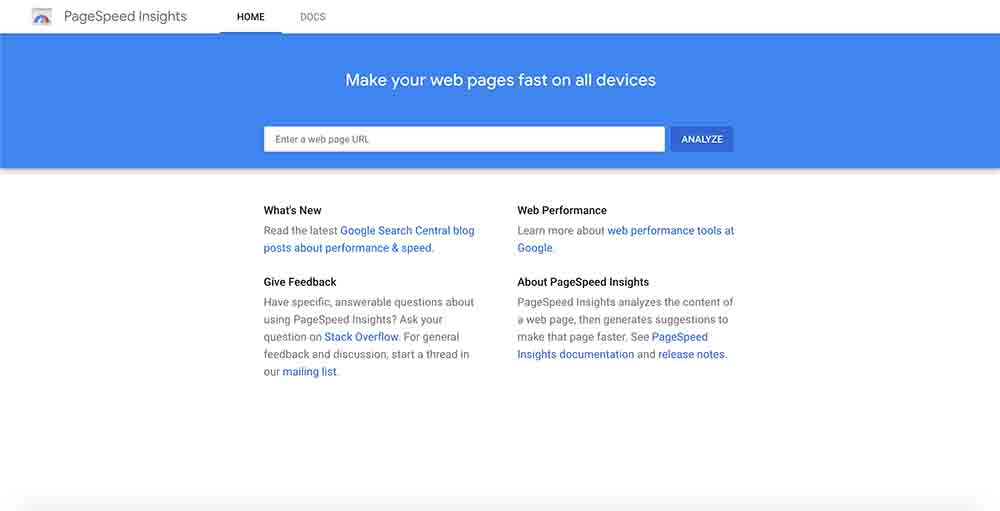
After 30 seconds, you will receive the test result. However, if you run the Lighthouse in this way, it will only analyze the Performance of the website.
d. Install and run the Node command-line tool
Install Google Chrome, install Node and the current Long Term Support version of Node.
Install Lighthouse:
Npm install -g lighthouseTo run the test:
Lighthouse <url>To see all options:
Lighthouse --help2. How to use Google Lighthouse to test website speed?
To check the speed of the website with Lighthouse you can use all the ways to run Lighthouse outlined above and focus on the performance indicators – these are indicators related to website speed.
If you only care about website speed indicators, you can use Lighthouse by running PageSpeed Insights – a Google site speed tool. PageSpeed Insights reports will show speed scores based on lab data analyzed by Lighthouse.
III. Audit Metrics of Google Lighthouse
To be able to use Lighthouse effectively, you also need to find out what issues this tool checks for, and what the indicators are and what they mean. Do not miss the useful knowledge below!
1. Performance
Performance metrics show how long does this page take to show content and become usable.
Performance metrics include: First Contentful Paint (FCP), Speed Index, Largest Contentful Paint (LCP), Time to Interactive (TTI), Total Blocking Time (TBT) and Cumulative Layout Shift (CLS).
- First Contentful Paint is the time at which the first text or image is painted.
- Speed Index is how long the contents of a page are visibly populated.
- Largest Contentful Paint is the time at which the largest text or image is painted.
- Time to interact marks the amount of time it takes for the page to become fully interactive.
- Total Block Time is the sum of all blocking times between FCP and Time to Interaction, where the blocking time is calculated by long task execution time (which is a task with execution time> 50 milliseconds) subtract 50 milliseconds.
- Cumulative Layout Shift measures the movement of visible elements within the viewport.
2. Accessibility
The Accessibility tests highlight opportunities to improve the accessibility of your web application. Only a subset of accessibility problems can be detected automatically, so manual testing is also recommended.
3. Best Practices
The Best Practices test whether this site follows best practices for modern web development.
4. SEO
The SEO test ensures that your page is optimized for search engine result rankings.
5. Progressive Web App
PWA is a website developed by technologies that allow optimal user experience on mobile devices compared to a normal website. These checks validate the aspects of a Progressive Web App.
Website speed is a factor to notice and improve when doing business online. To test website speed, Lighthouse pagespeed test is a reliable and useful tool for you.
After checking if your Magento website is slow, immediately install our Magento 2 Speed Optimizer Extension to optimize web speed.
If you want to improve website speed in the most professional and effective way, please use our Magento Speed Optimization Service.
Please refer to other Magento 2 Extensions and Magento 2 Services.
We hope this article will help you!